Trusted for accuracy. Built to scale.
Perfectly Clear, our automated image enhancement and correction technology, helps save time, cut costs and boost revenue.
With over 50 trillion photos corrected every year, we're trusted by businesses to accelerate sales
Companies scaling with Perfectly Clear
“When I look at our sales data for our portrait business, the summer period from one year to the next, the volume of sales increased about 12% [since implementation].”
 Cameron LeeNorwegian Cruise Lines
 Hallmark
 Norwegian Cruise Line
 Photobox
 Corel
Corel OPPO
OPPO
Efficient ways to perfect your images
View every technology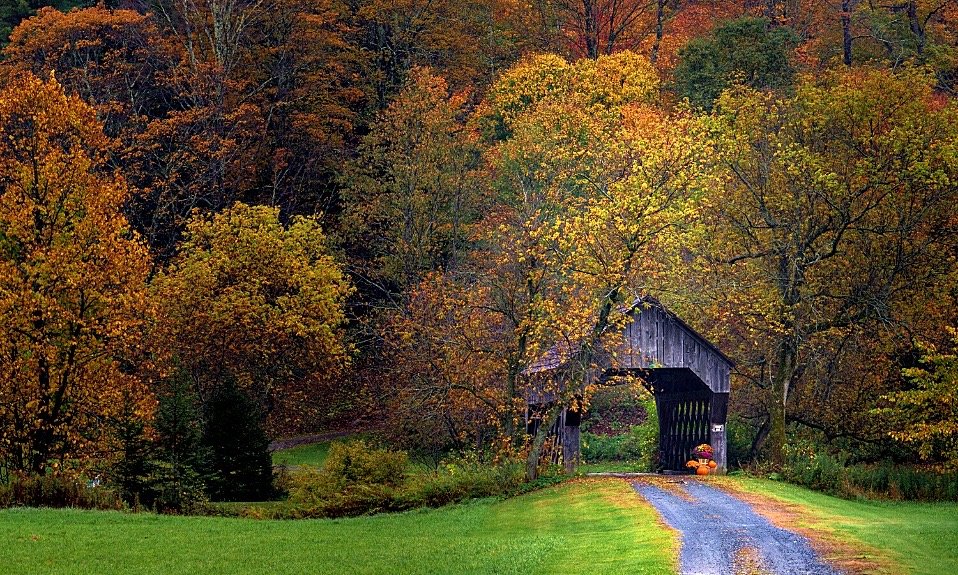
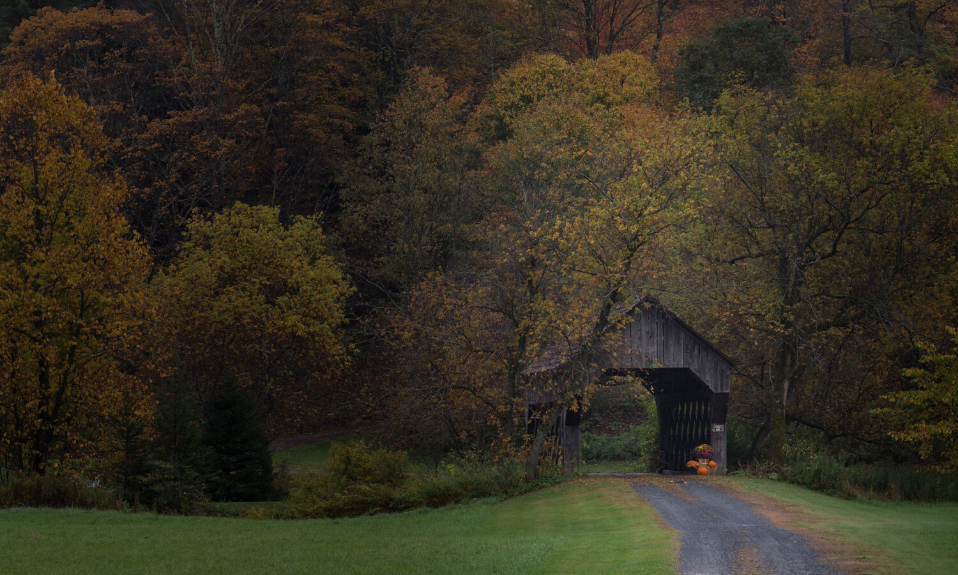 Automatic Image CorrectionView technology
 Image UpscalingView technology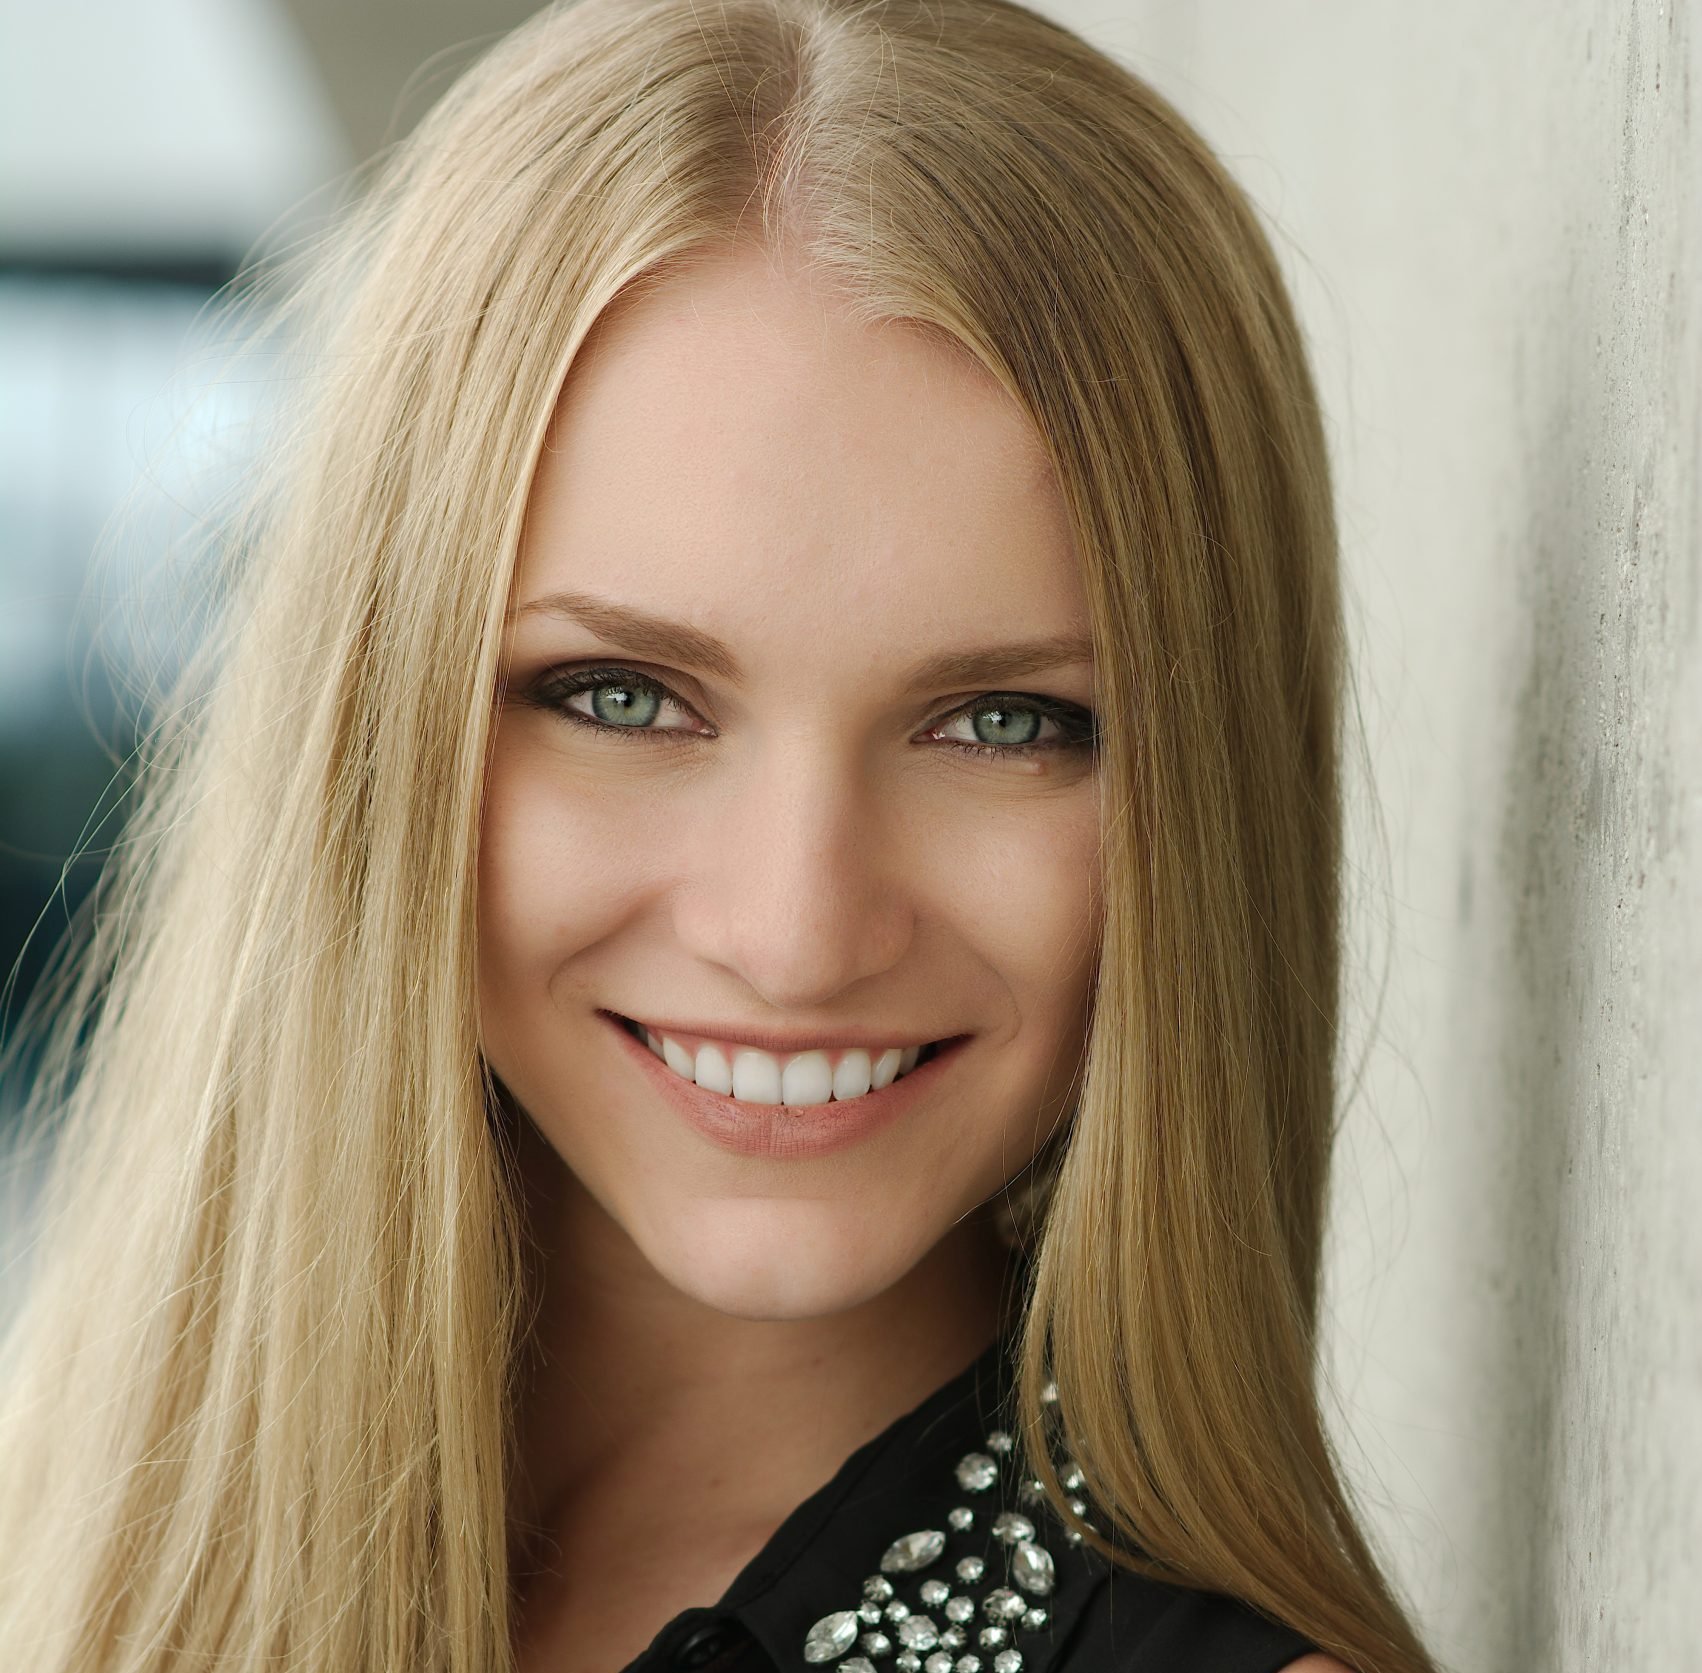
 Image RetouchingView technology
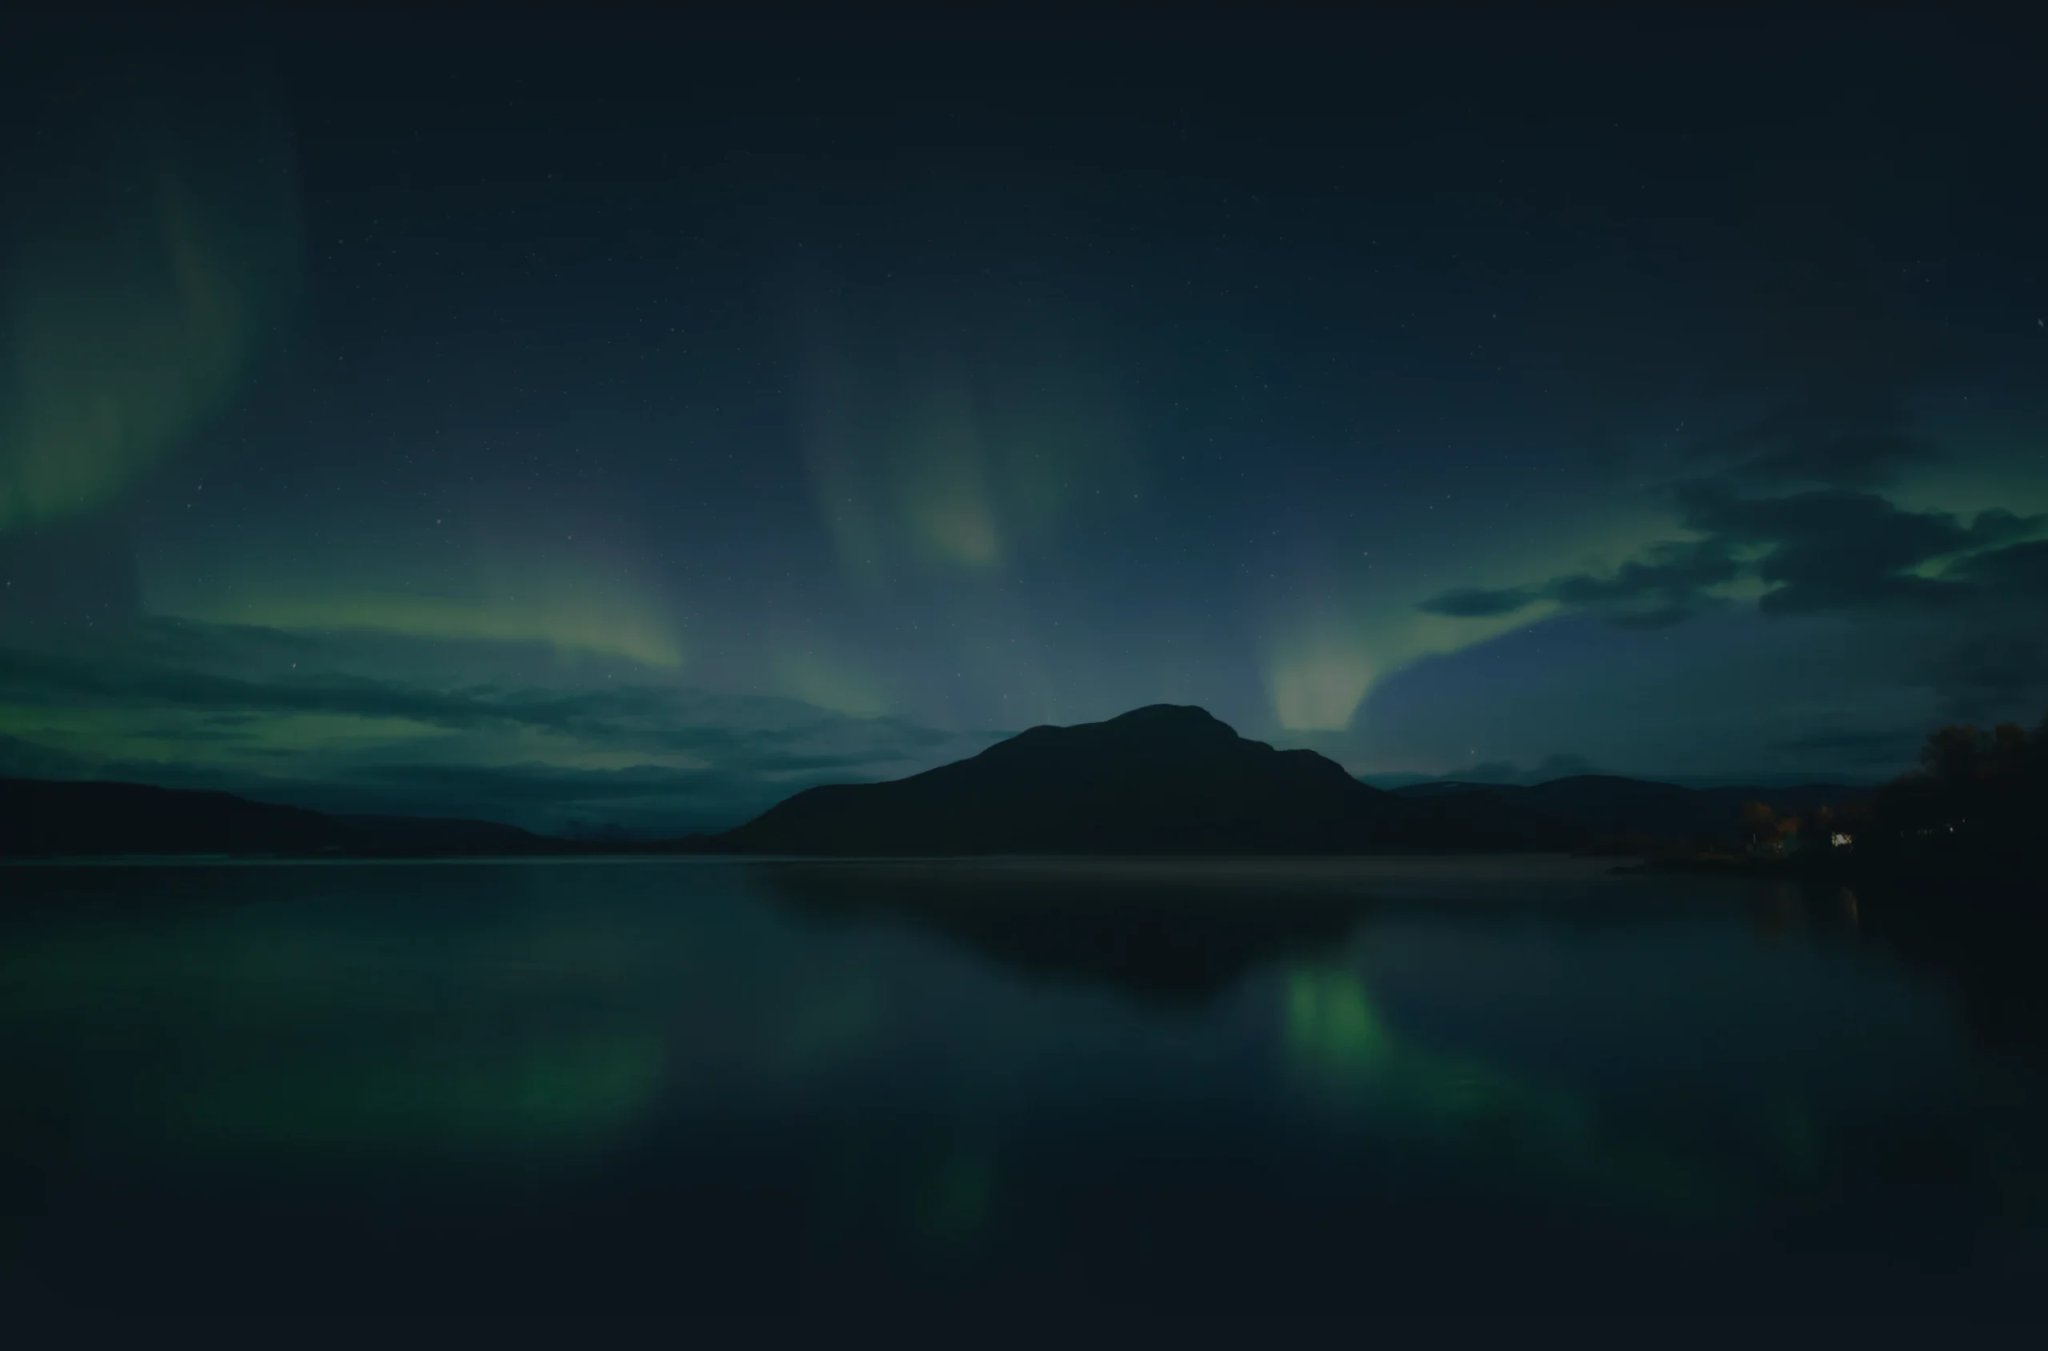
 Creative LOOKsView technology
Calculate your gains instantly
Find out how Perfectly Clear can increase your revenue.
Increase revenue
“When I look at our sales data for our portrait business, the summer period from one year to the next, the volume of sales increased about 12% [since implementation].”
Outshine your competitors
“Since we started using Perfectly Clear, we haven't had a single order rejected and we are getting superb reviews on our App Store & Play Store.”

Reduce costs
“Our [print] returns have diminished between 60% to 75%, and I feel that we still have room for more positive outcome in the near future.”
Helping businesses grow by accelerating workflows

Attractions, Amusements & Cruise Lines
Norwegian Cruise Line increased their sales volume by 12%+ using Perfectly Clear.
Find out how


More sales, lower costs, less editing time
Customers count on us to improve their ROI.
- Norwegian Cruise Line
“When I look at our sales data for our portrait business, the summer period from one year to the next, the volume of sales increased about 12% [since implementation].”
View story  Geskus Photography
“On an average school day shoot (400 students), this could take approximately 45 minutes. Now, using our own defined Perfectly Clear presets, we can process that same job in about 20 minutes, and we do not need to test.”
View story Nations Photo Lab
“We save more time than ever in our workflow. For example, Perfectly Clear took 81 seconds to edit 241 images. This would have taken two hours with only Kodak. That’s a 98% reduction in editing time.”
View story Sniper Action Photo
“We’ve used Perfectly Clear in our automated photo systems at Sniper Action Photo for years, and it continues to play an important role in delivering high-quality images across a wide range of lighting conditions.”
View story Marathon Press
“I know we avoided a TON of costly expenses by jumping on board with Perfectly Clear right away.”
View story
Choose your solution
Ready-to-use solutions
Start batch editing right away, online, on your phone, or with our desktop automatic photo enhancement software.
 Cloud Jobs Batch Processor: Instant corrections in your browser
 Hot folder: Batch editing from your desktop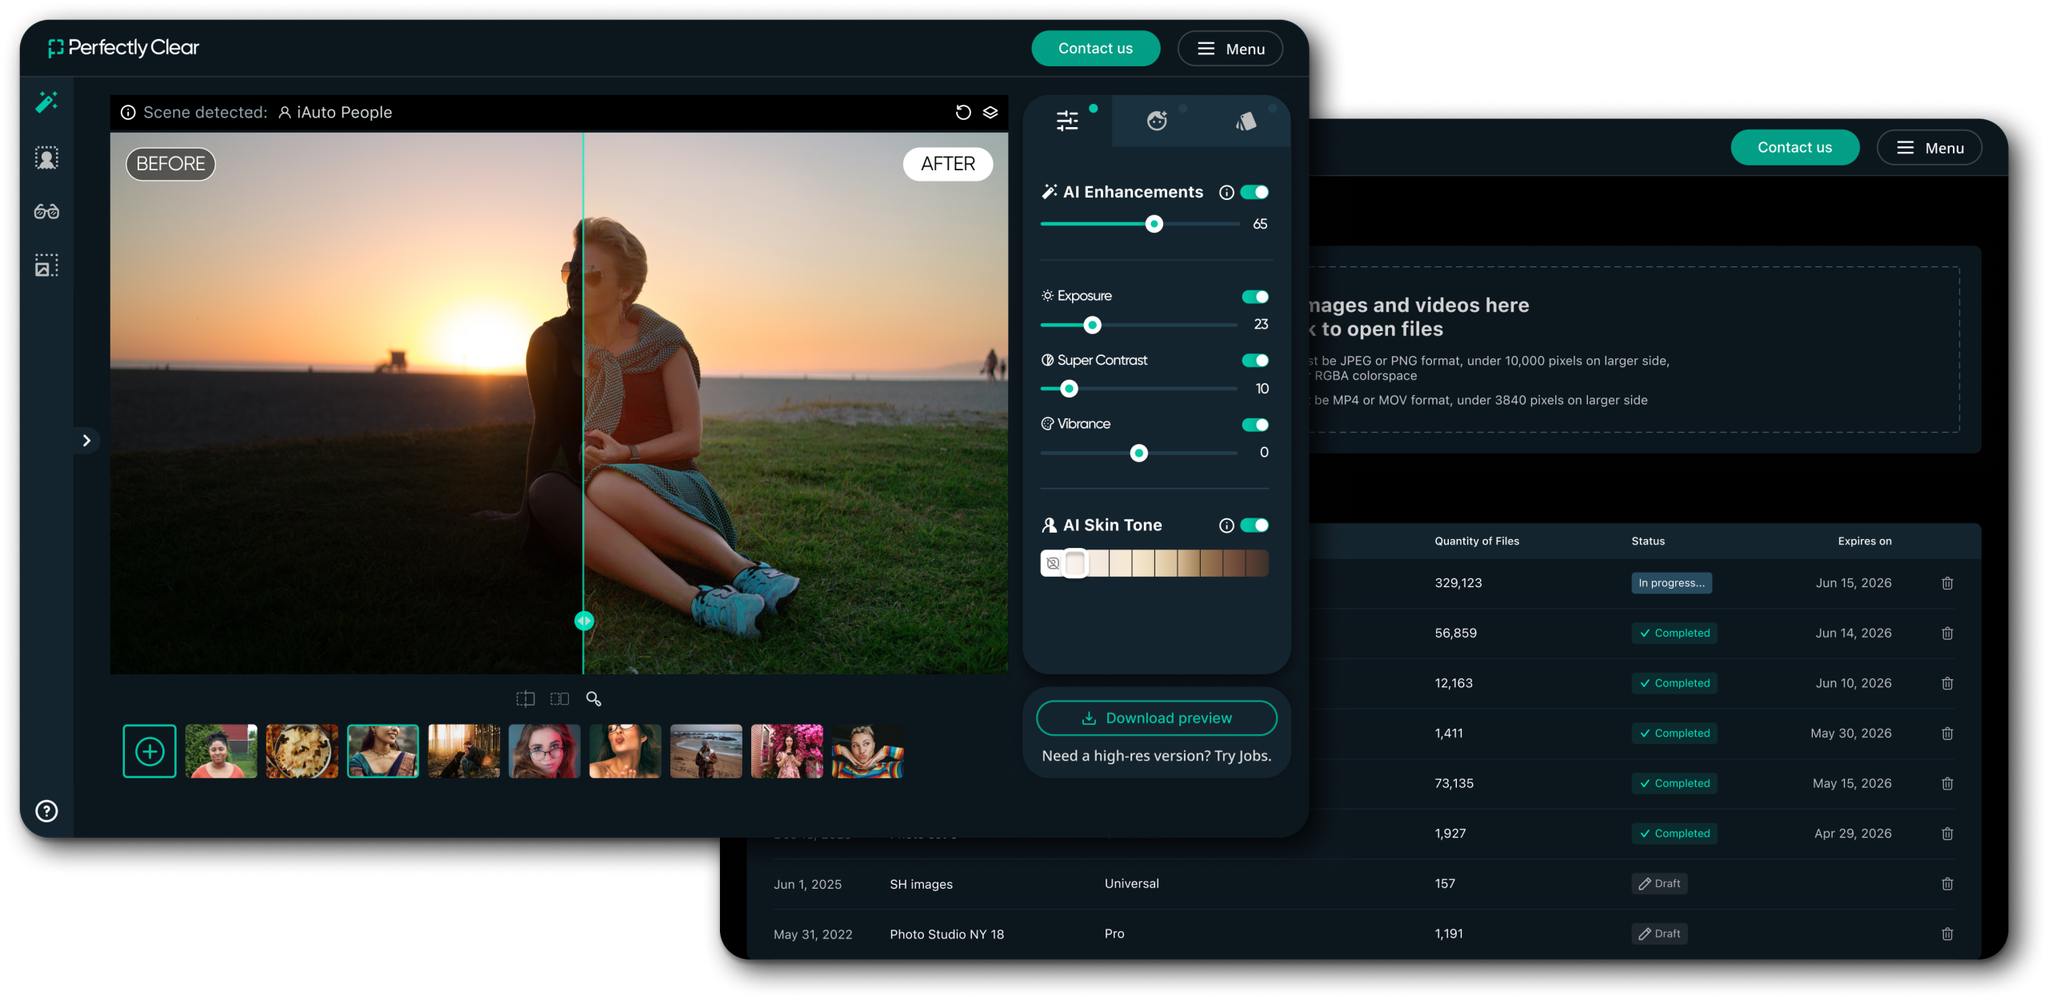
Build with Perfectly Clear
Integrate our technology seamlessly into your business through one of our many developer tools.
 SDK
SDK Web API
 Docker Container
 Command Line